Color Vision Deficiency (CVD), commonly known as color blindness, affects a significant portion of the population, including nearly 8% of genetic males and 0.5% of genetic females. In fields where color plays a crucial role in conveying information, such as meteorology, individuals with CVD face challenges in interpreting data accurately. For scientists in the weather radar community, the ability to differentiate between colors is essential in analyzing cloud characteristics and storm intensity. However, traditional colormaps used in radar meteorology often overlook the needs of individuals with CVD, leading to confusion and misinterpretation of vital information.
Recognizing the limitations of existing colormaps, researchers from the U.S. Department of Energy’s Argonne National Laboratory embarked on a mission to develop CVD-friendly colormaps tailored to the specific needs of the radar community. The team’s primary focus was on creating colormaps that not only accommodated individuals with CVD but also maintained perceptual uniformity, ensuring that changes in color accurately reflected changes in data values without introducing unnecessary complexity.
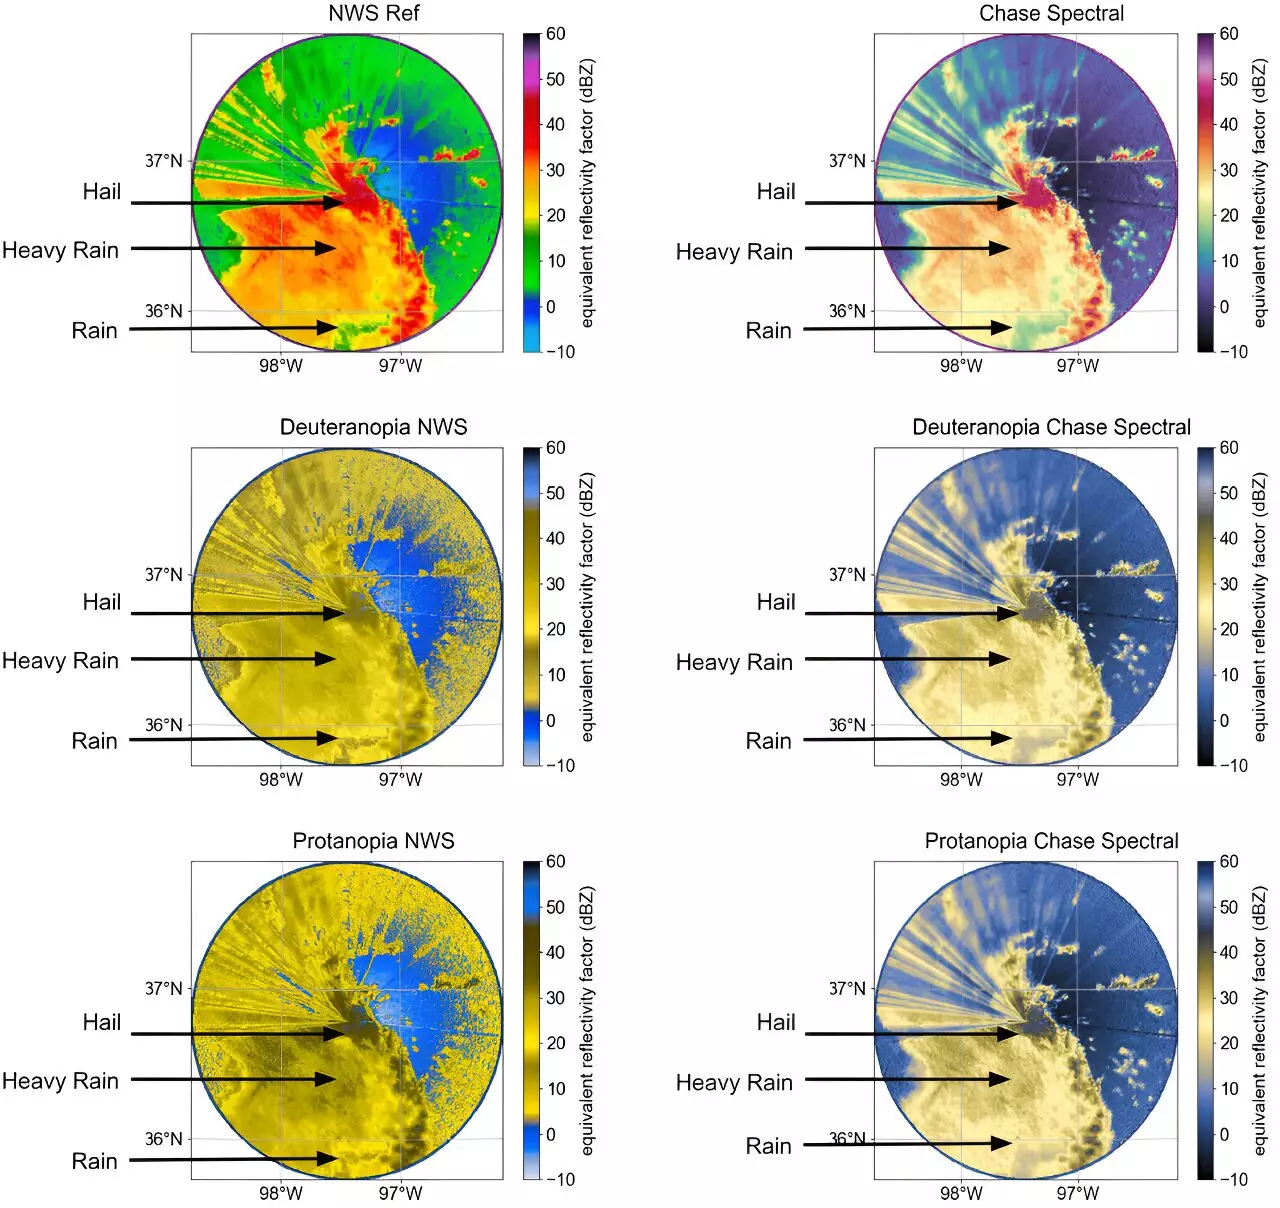
By leveraging Python programming language tools, the researchers were able to design new colormaps, such as the CVD-friendly Ze and velocity colormaps, that provided distinct color representations for different weather phenomena, including rain, hail, and drizzle. Through rigorous testing and feedback from the CVD community, the researchers refined their colormaps to ensure optimal interpretability and inclusivity. The new colormaps not only outperformed traditional colormaps in terms of clarity and accessibility but also garnered positive responses from radar researchers who participated in the testing process.
The introduction of CVD-friendly colormaps into the radar meteorology community has had a profound impact on how data is visualized and interpreted. Not only have these colormaps enhanced the accessibility of radar data for individuals with CVD, but they have also paved the way for a more inclusive and equitable scientific visualization practice. As the colormaps become more widely adopted and integrated into open-source radar software packages, the radar meteorology community is poised to embrace a new standard of visual representation that prioritizes inclusivity and clarity.
Moving forward, the research team aims to expand their collection of CVD-friendly colormaps and engage in further outreach to promote widespread adoption and understanding within the meteorological community. By presenting their findings at scientific conferences and soliciting feedback from diverse stakeholders, the researchers are fostering a culture of collaboration and inclusivity that transcends geographical boundaries. Ultimately, the goal is to establish a global community practice that embraces the importance of accessible and inclusive scientific visualization in radar meteorology.
As the landscape of meteorology evolves, with a new generation of students entering the field, the integration of CVD-friendly colormaps into radar meteorology tools is becoming increasingly normalized. By equipping future meteorologists with the tools and resources necessary to work with inclusive colormaps, the research team is laying the foundation for a more diverse and inclusive meteorological community. As these students graduate and enter professional roles, they will bring with them a commitment to accessible and equitable scientific visualization, ensuring that inclusivity remains at the forefront of meteorological practices for years to come.
Leave a Reply